Wilmington Wastewater Treatment Plant Weather Page
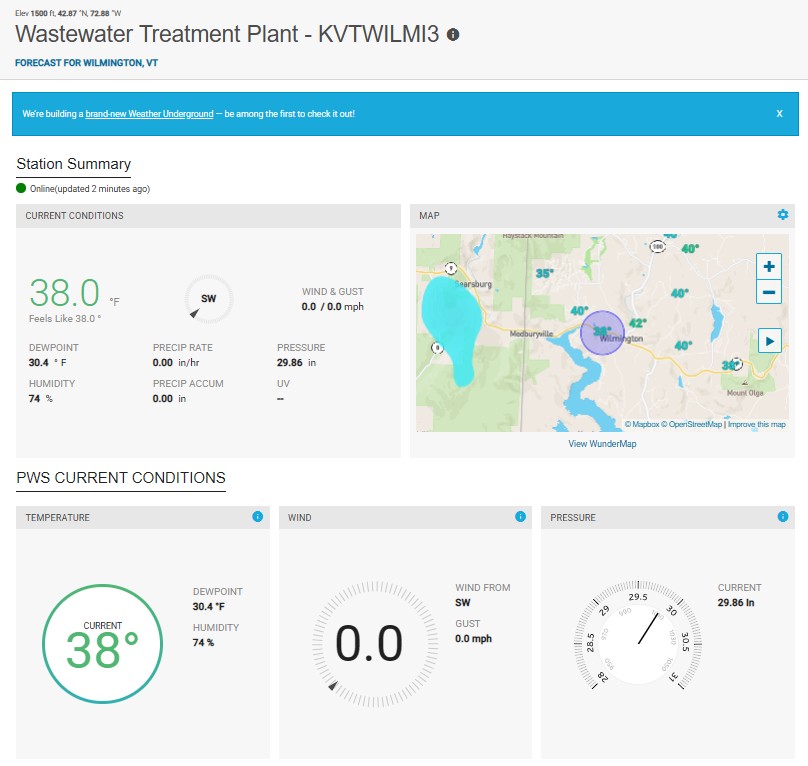
Our Weather Underground weather station with real time updated weather conditions!

Daily Precipitation Data! (updated 2/18/26)
Precipitation data can also be found here!
Monthly Weather Data! update 2/18/26
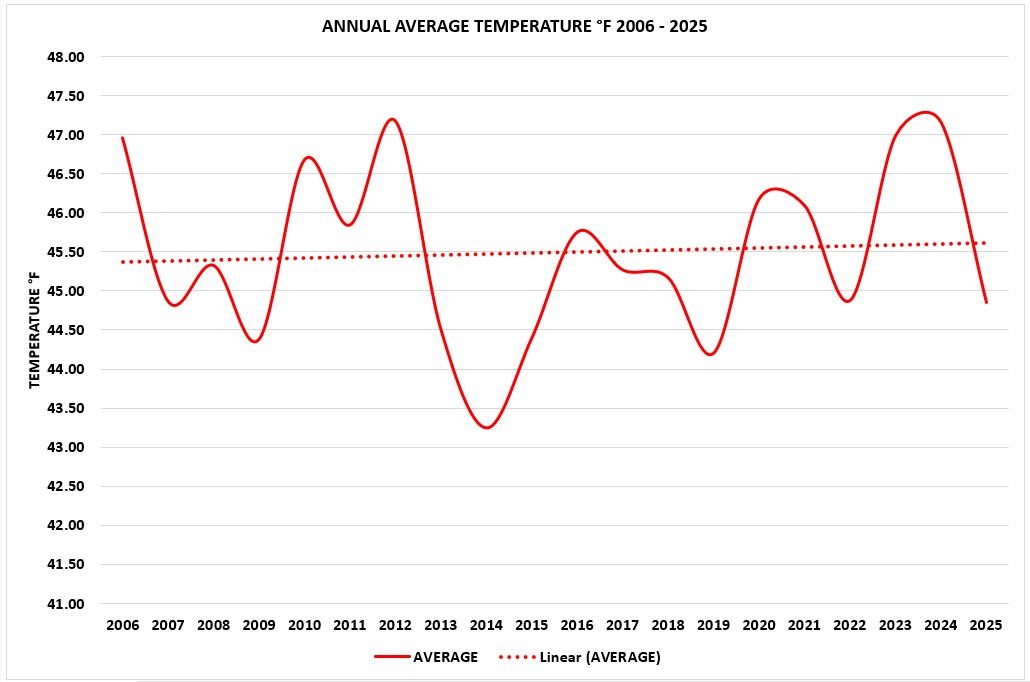
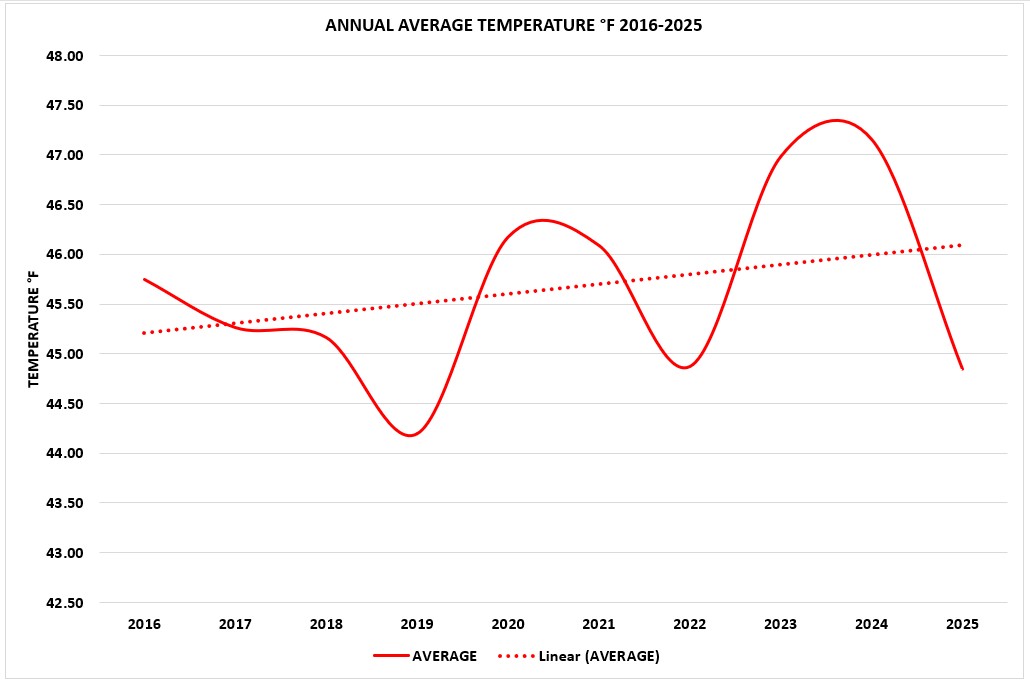
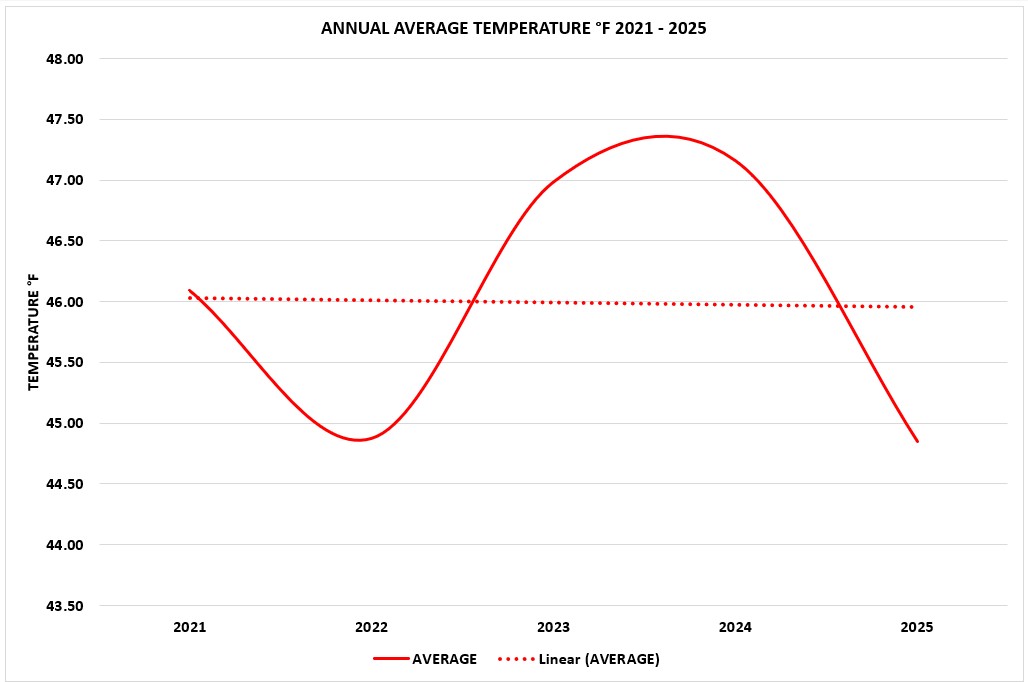
Annual temperature charts!
Based on data recorded at the Wilmington Wastewater Treatment Plant 2006 – 2025.
“A linear trend is a statistical method used to identify and model the general direction of data over time. It involves fitting a straight line to a dataset, typically with time as the independent variable and the observed values as the dependent variable. This technique is widely used in time series analysis, forecasting, and regression modeling.”
2006-2025
2016 – 2025
2021 – 2025
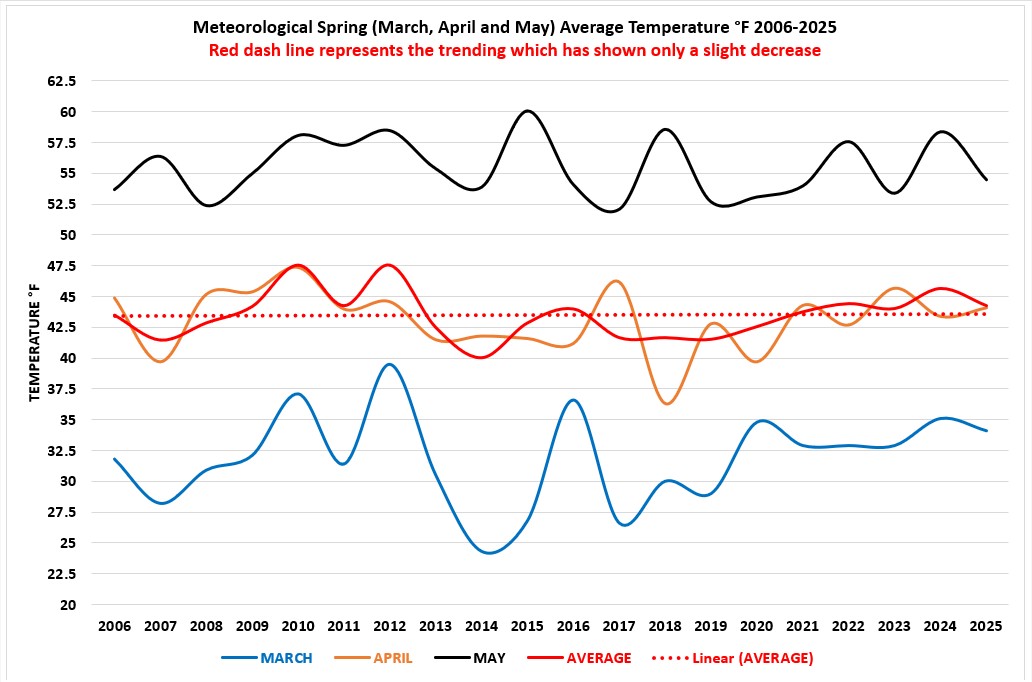
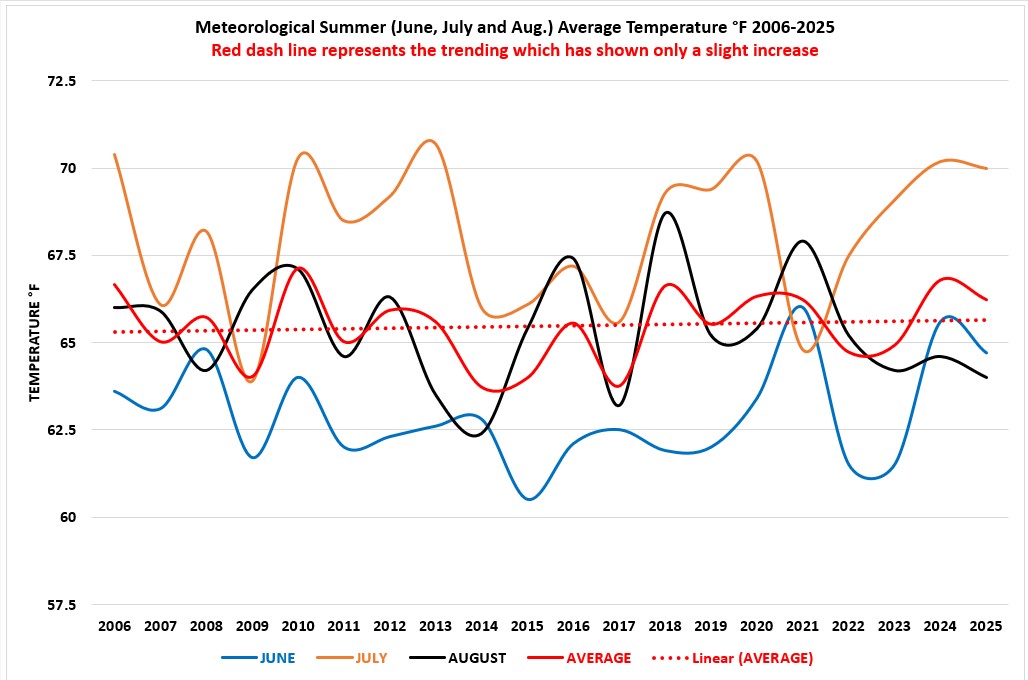
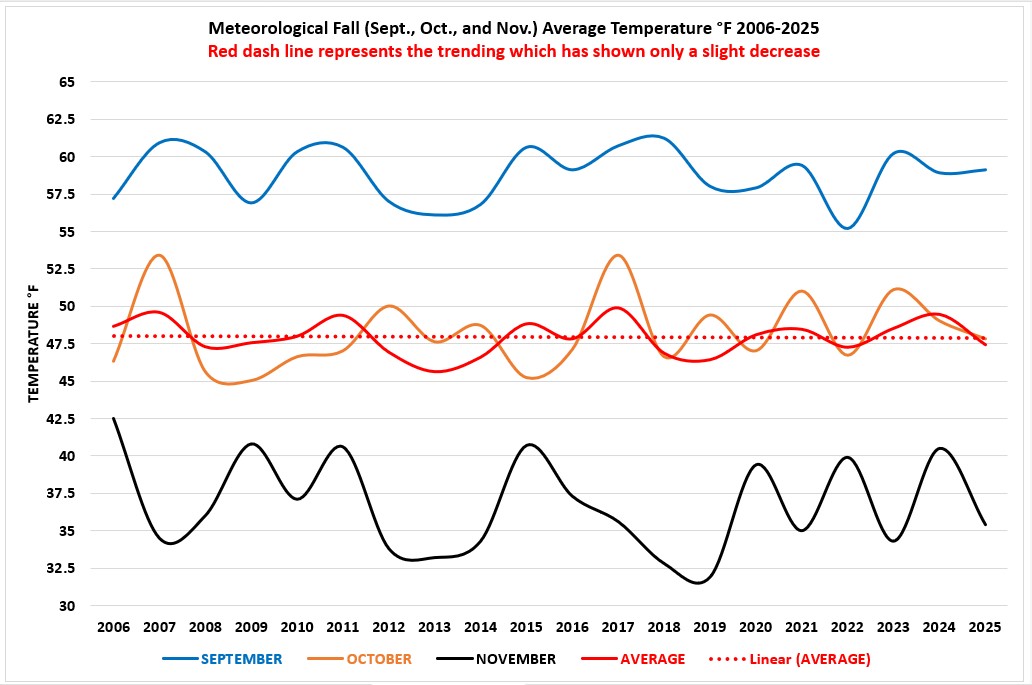
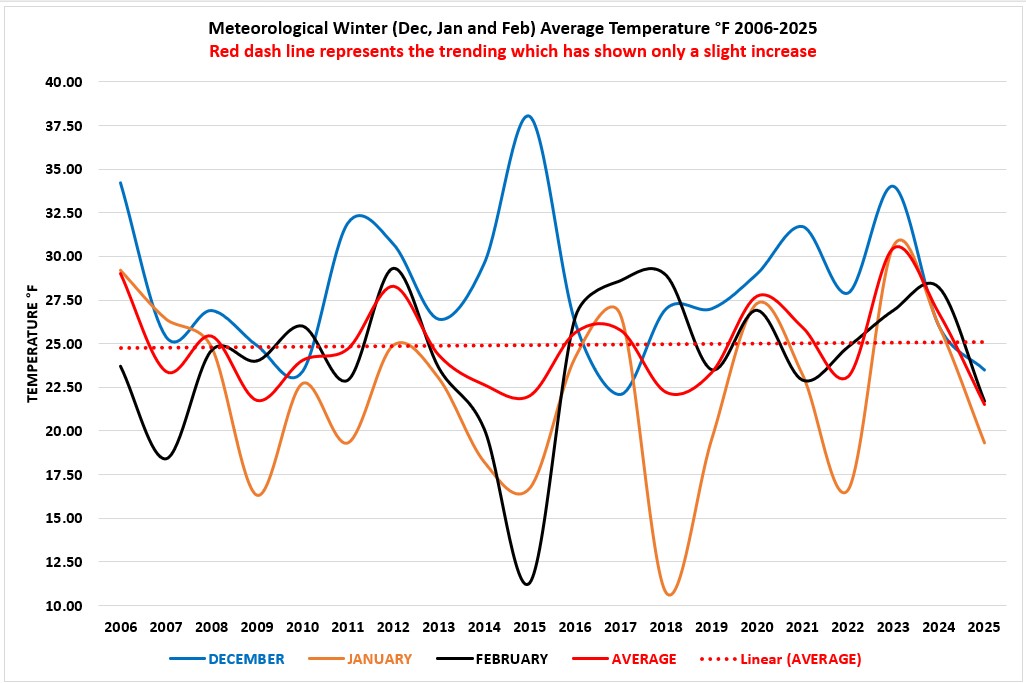
Seasonal Charts
“Meteorological seasons are defined by the Gregorian calendar and are based on annual temperature cycles, dividing the year into four fixed three-month periods. Meteorological seasons are categorized into four distinct periods based on the annual temperature cycle, which allows for easier weather observation and climate analysis. The seasons are defined as follows:
Winter: December, January, and February
Spring: March, April, and May
Summer: June, July, and August
Autumn (Fall): September, October, and November
Each season begins on the first day of its starting month and ends on the last day of the third month.”
Spring
Summer
Fall
Winter
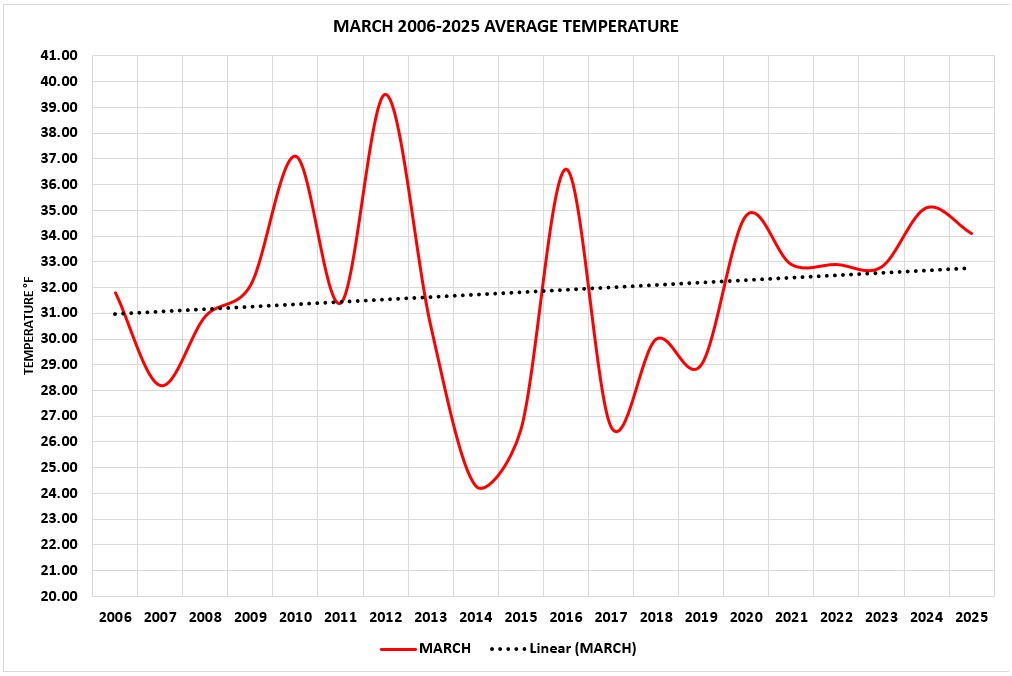
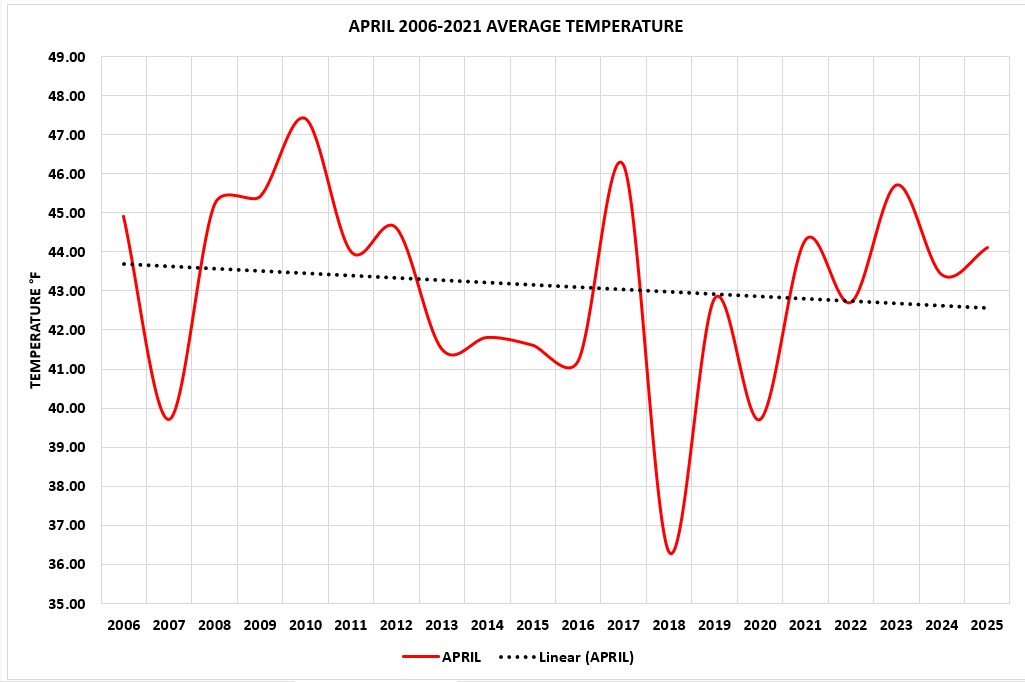
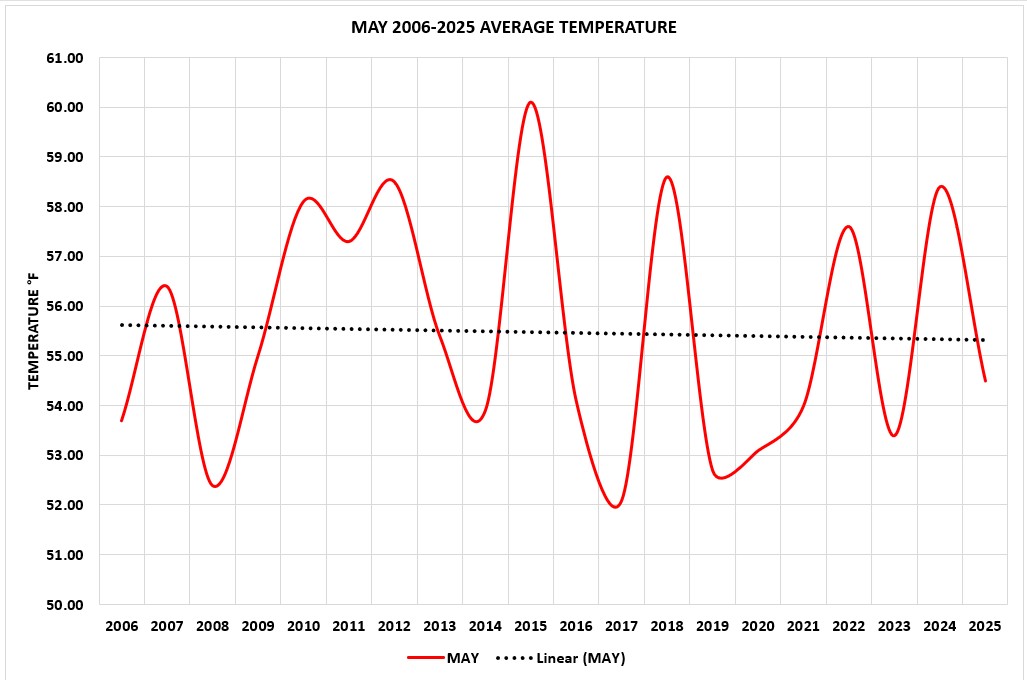
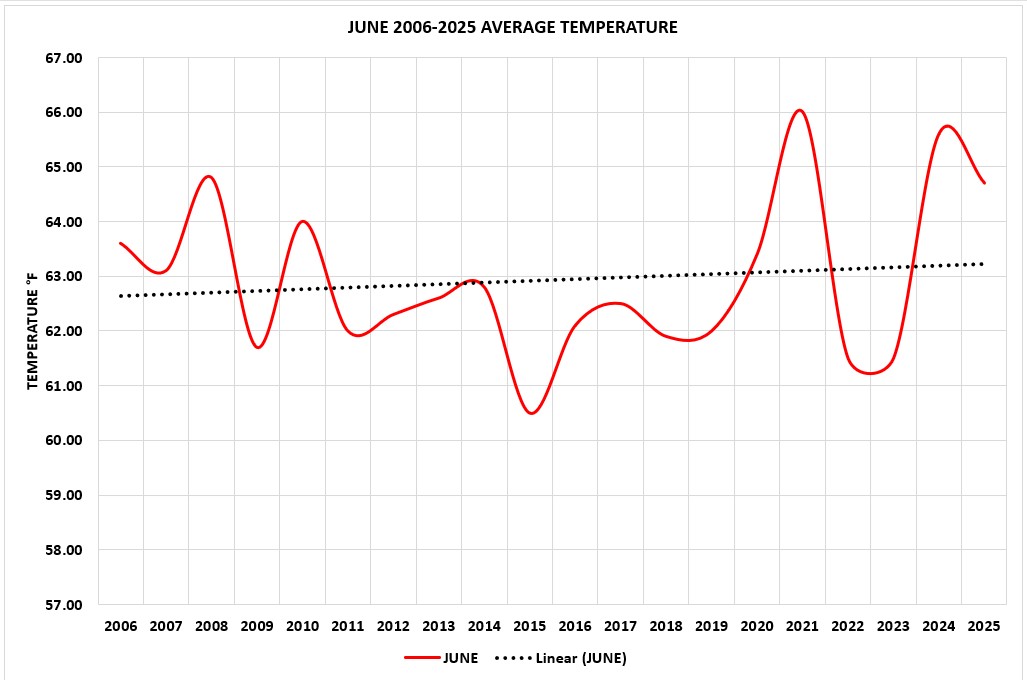
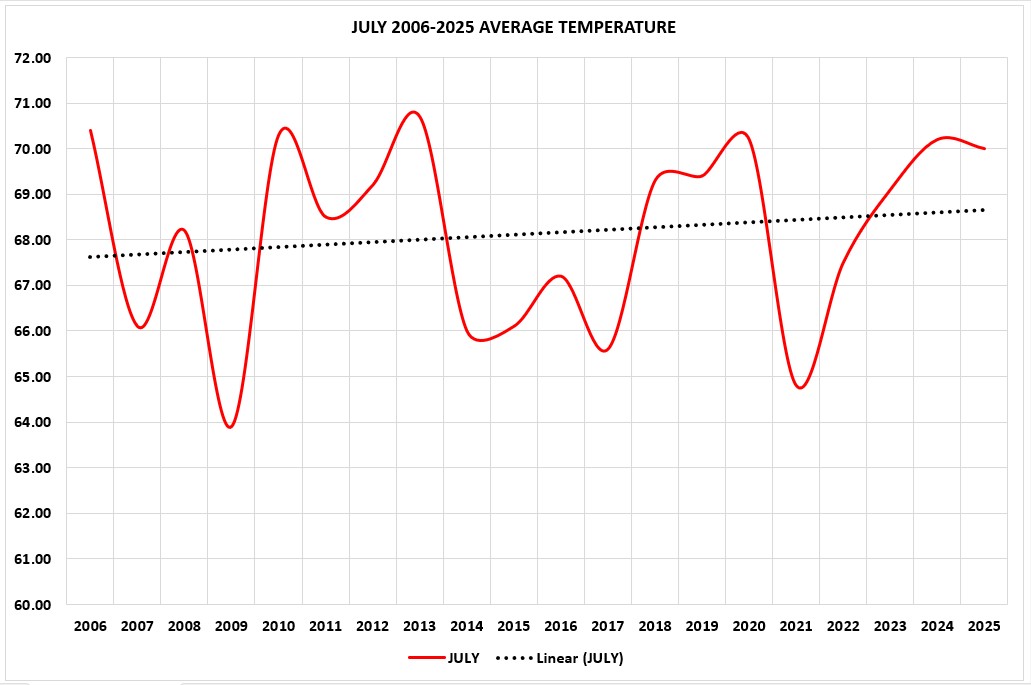
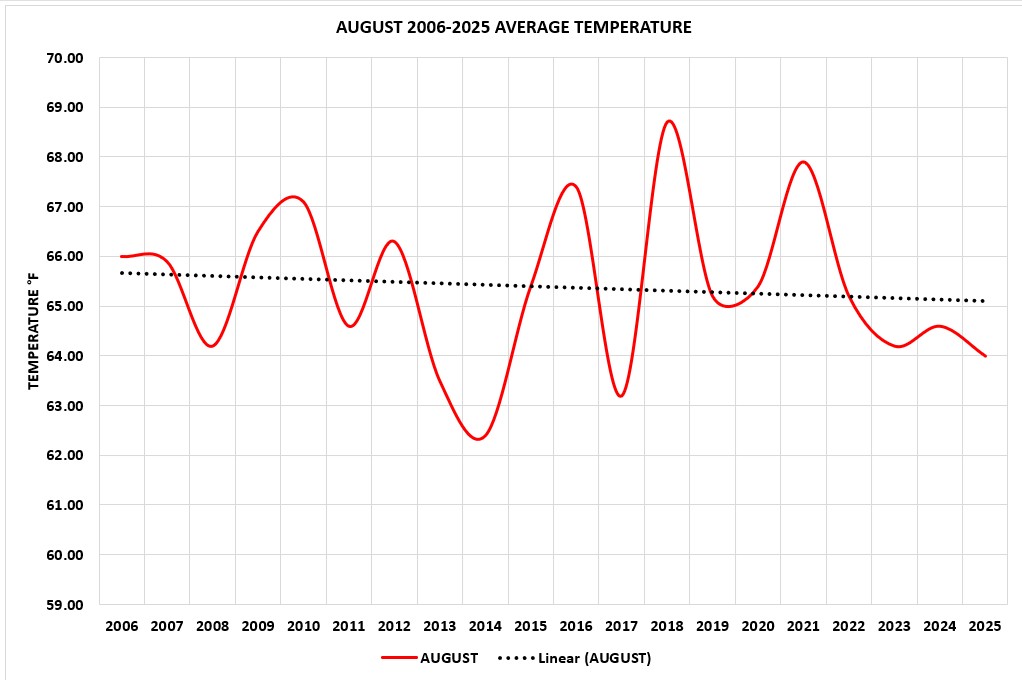
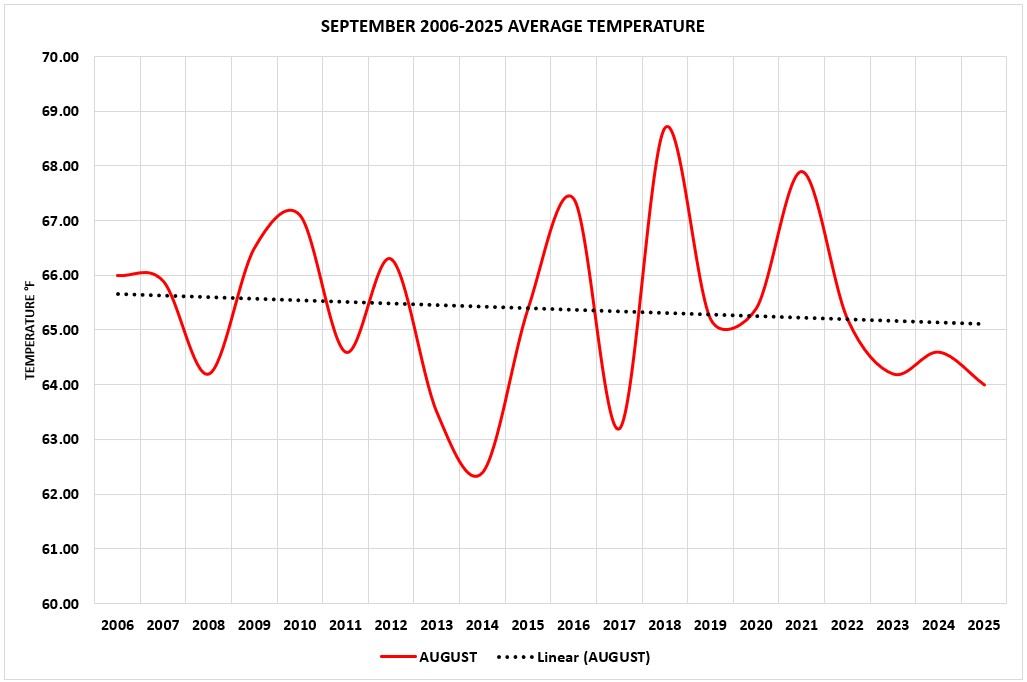
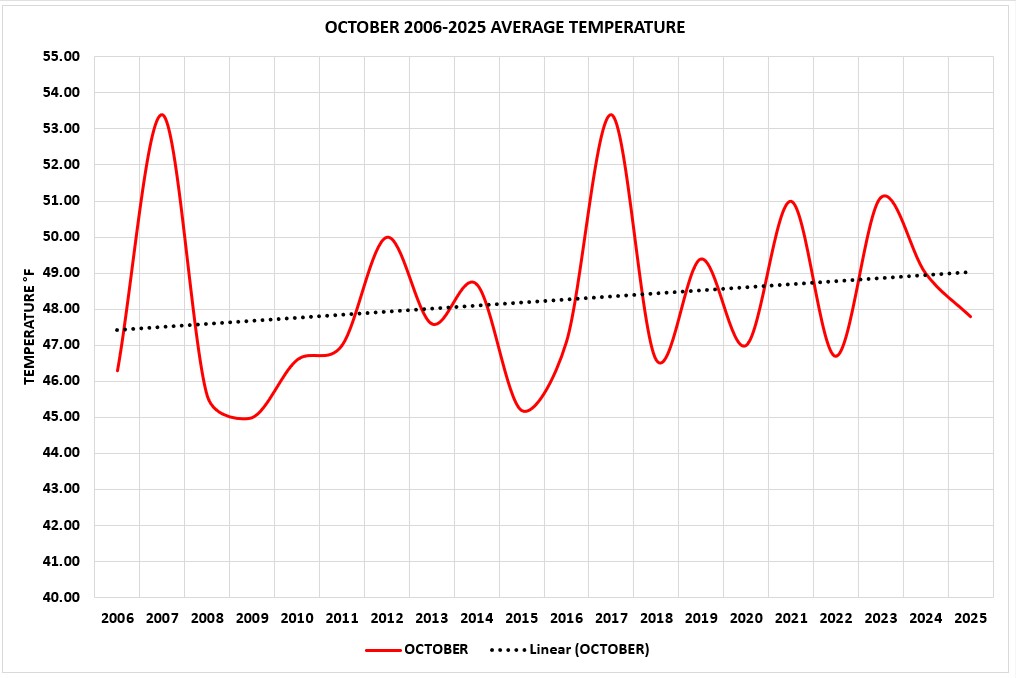
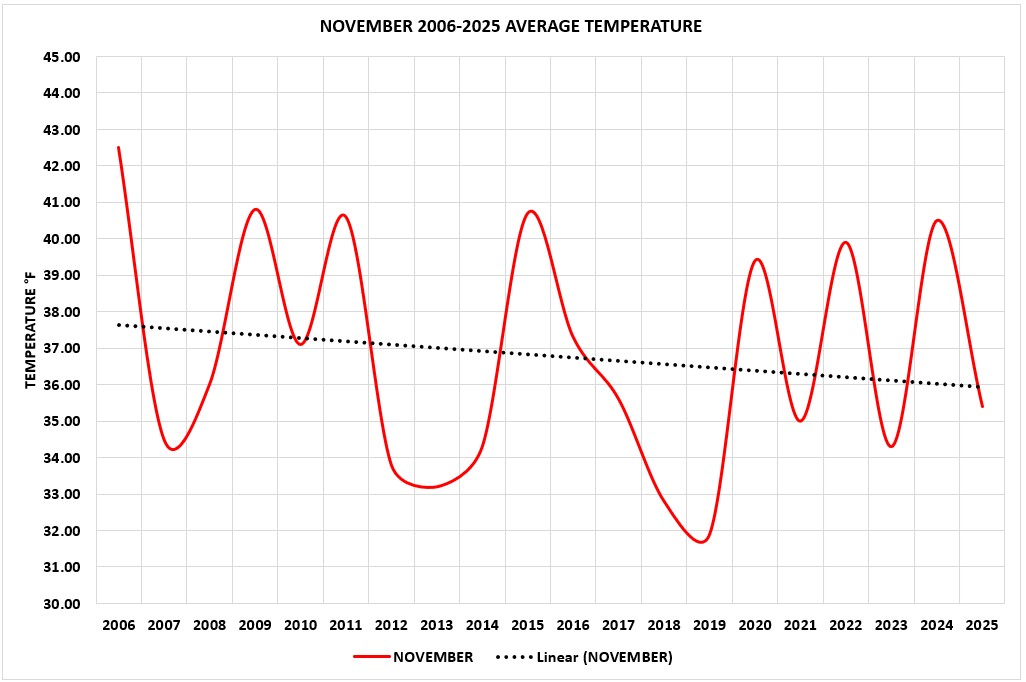
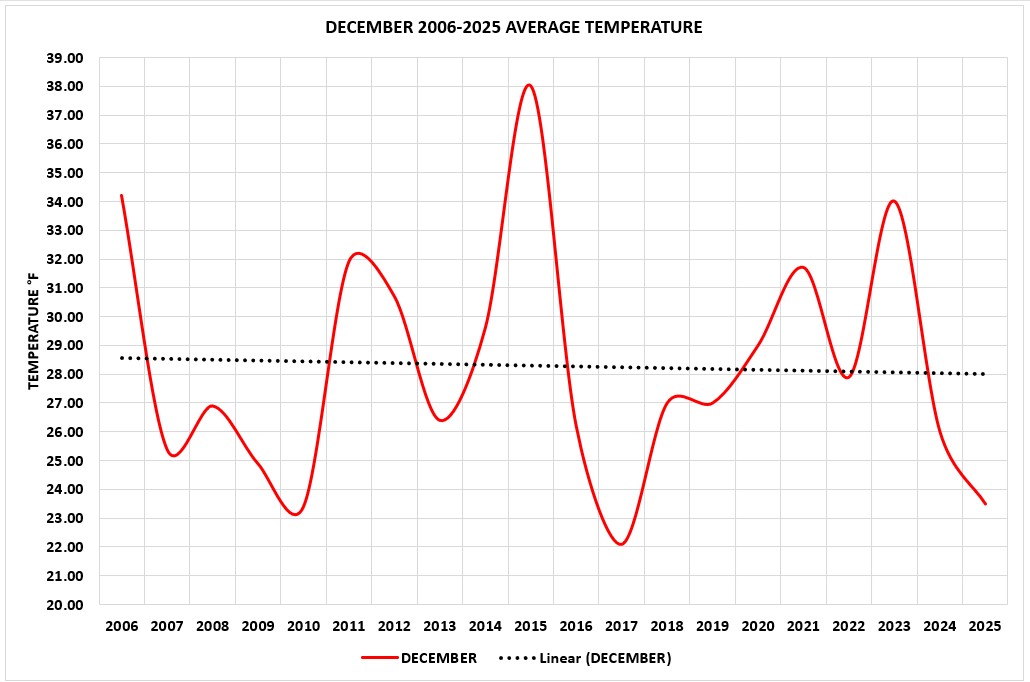
Monthly Charts and Trends!
JANUARY

FEBRUARY

MARCH
APRIL
MAY
JUNE
JULY
AUGUST
SEPTEMBER
OCTOBER
NOVEMBER
DECEMBER
Click here to return to the Wilmington Wastewater Department home page.